

Global entertainment and media company Warner Bros. Discovery (NASDAQ:WBD) fell short of the markets revenue expectations in Q3 CY2025, with sales falling 6% year on year to $9.05 billion. Its GAAP loss of $0.06 per share was $0.03 above analysts’ consensus estimates.
Is now the time to buy Warner Bros. Discovery? Find out by accessing our full research report, it’s free for active Edge members.
Warner Bros. Discovery (WBD) Q3 CY2025 Highlights:
- Revenue: $9.05 billion vs analyst estimates of $9.22 billion (6% year-on-year decline, 1.9% miss)
- EPS (GAAP): -$0.06 vs analyst estimates of -$0.09 ($0.03 beat)
- Adjusted EBITDA: $2.47 billion vs analyst estimates of $2.19 billion (27.3% margin, 13% beat)
- Operating Margin: 6.8%, up from 2.9% in the same quarter last year
- Free Cash Flow Margin: 7.8%, up from 6.6% in the same quarter last year
- Market Capitalization: $56.35 billion
Company Overview
Formed from the merger of WarnerMedia and Discovery, Warner Bros. Discovery (NASDAQ:WBD) is a multinational media and entertainment company, offering television networks, streaming services, and film and television production.
Revenue Growth
Examining a company’s long-term performance can provide clues about its quality. Any business can have short-term success, but a top-tier one grows for years. Luckily, Warner Bros. Discovery’s sales grew at an exceptional 28.9% compounded annual growth rate over the last five years. Its growth beat the average consumer discretionary company and shows its offerings resonate with customers.
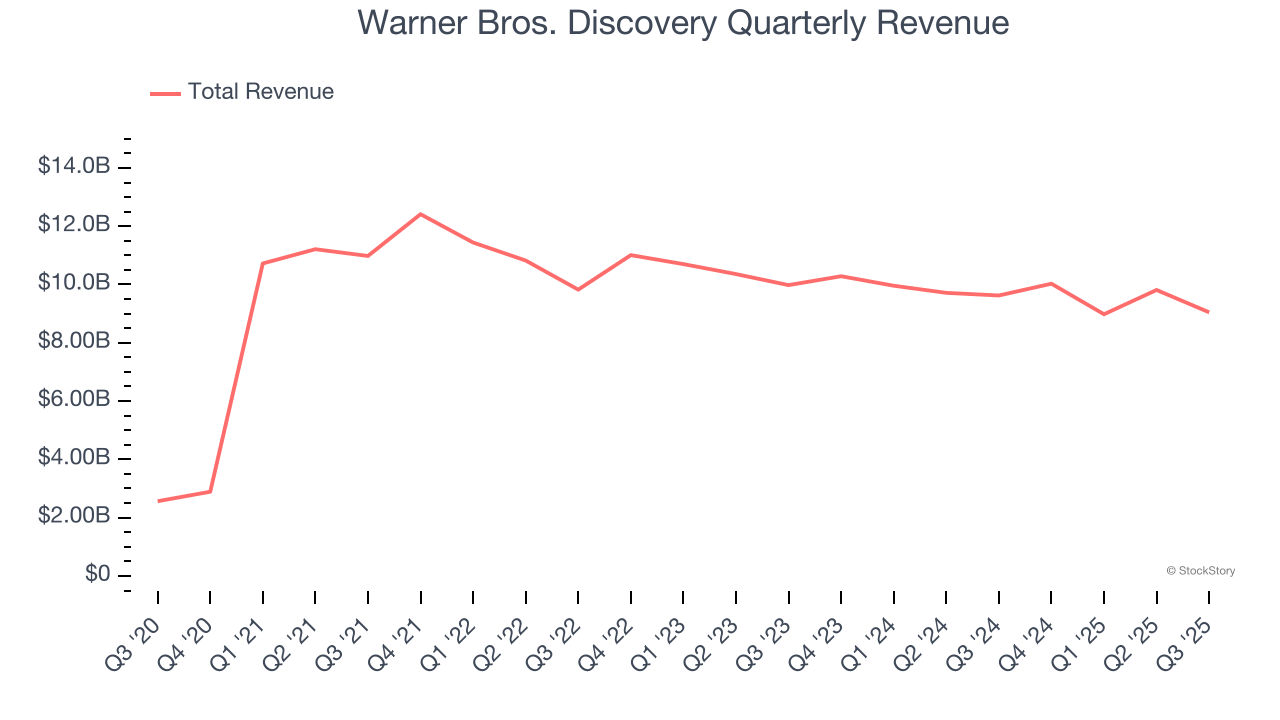
Long-term growth is the most important, but within consumer discretionary, product cycles are short and revenue can be hit-driven due to rapidly changing trends and consumer preferences. Warner Bros. Discovery’s recent performance marks a sharp pivot from its five-year trend as its revenue has shown annualized declines of 5.1% over the last two years. 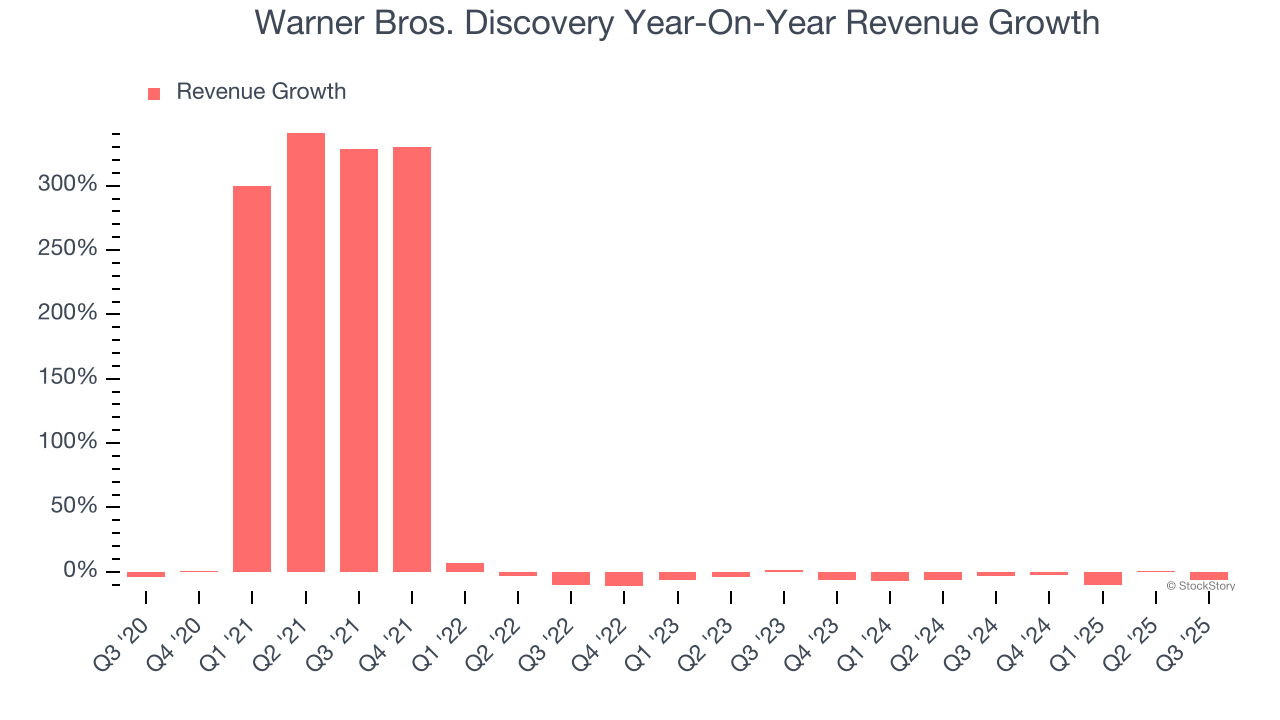
We can better understand the company’s revenue dynamics by analyzing its three most important segments: Distribution, Advertising, and Content, which are 52%, 15.6%, and 29.3% of revenue. Over the last two years, Warner Bros. Discovery’s revenues in all three segments declined. Its Distribution revenue (licensing fees) averaged year-on-year decreases of 2.2% while its Advertising (marketing services) and Content (films, streaming, games) revenues averaged drops of 8.8% and 7.5%. 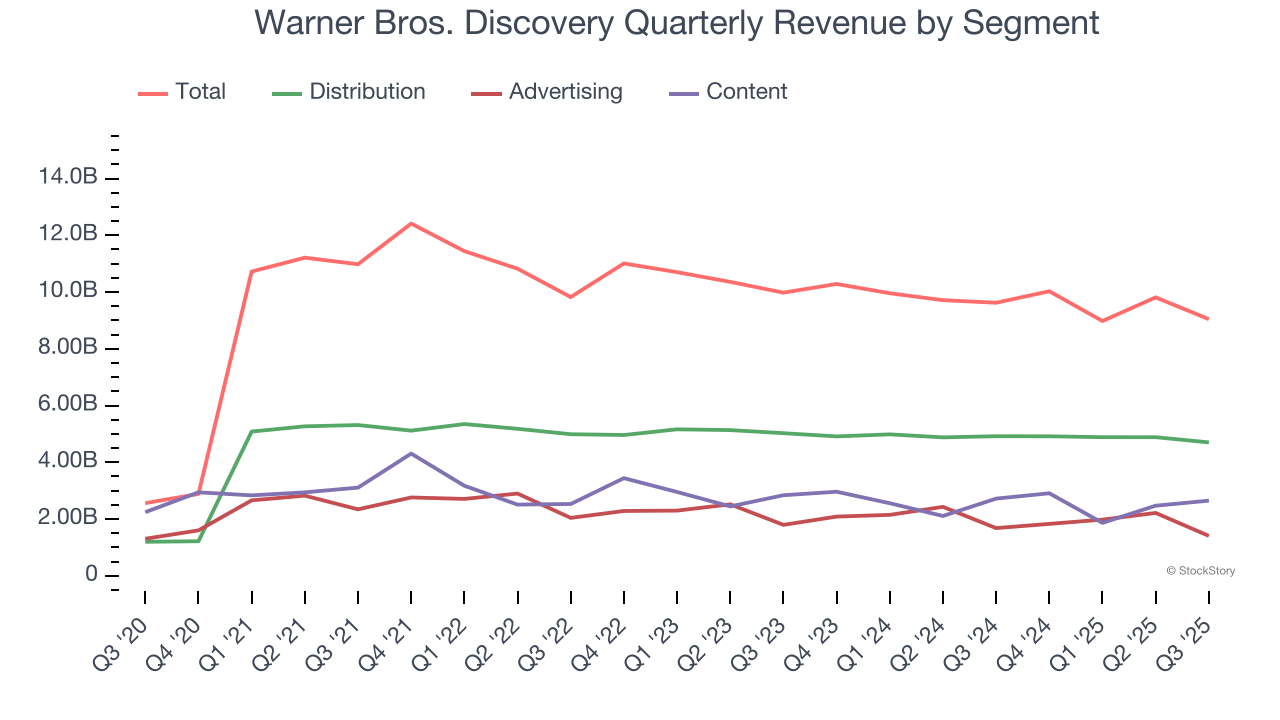
This quarter, Warner Bros. Discovery missed Wall Street’s estimates and reported a rather uninspiring 6% year-on-year revenue decline, generating $9.05 billion of revenue.
Looking ahead, sell-side analysts expect revenue to remain flat over the next 12 months. Although this projection indicates its newer products and services will spur better top-line performance, it is still below the sector average.
The 1999 book Gorilla Game predicted Microsoft and Apple would dominate tech before it happened. Its thesis? Identify the platform winners early. Today, enterprise software companies embedding generative AI are becoming the new gorillas. a profitable, fast-growing enterprise software stock that is already riding the automation wave and looking to catch the generative AI next.
Operating Margin
Warner Bros. Discovery’s operating margin has been trending up over the last 12 months, but it still averaged negative 12.7% over the last two years. This is due to its large expense base and inefficient cost structure.
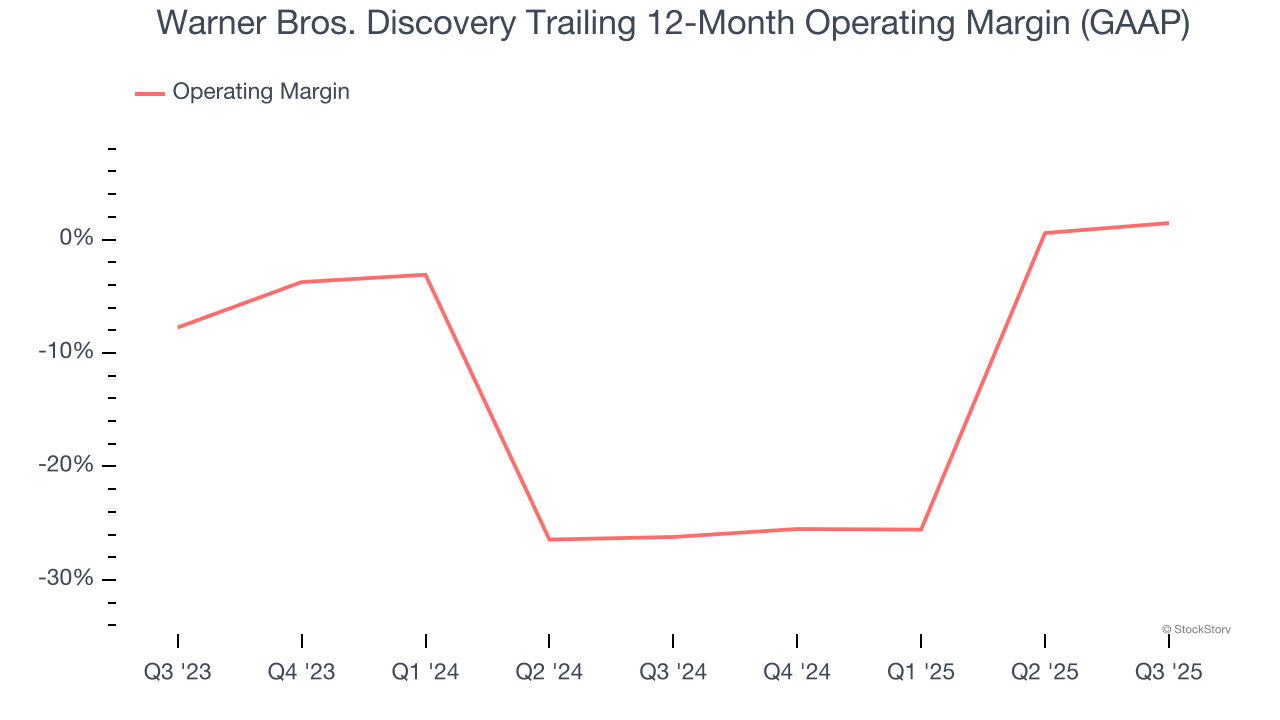
This quarter, Warner Bros. Discovery generated an operating margin profit margin of 6.8%, up 3.8 percentage points year on year. This increase was a welcome development, especially since its revenue fell, showing it was more efficient because it scaled down its expenses.
Earnings Per Share
We track the long-term change in earnings per share (EPS) for the same reason as long-term revenue growth. Compared to revenue, however, EPS highlights whether a company’s growth is profitable.
Sadly for Warner Bros. Discovery, its EPS declined by 38.2% annually over the last five years while its revenue grew by 28.9%. This tells us the company became less profitable on a per-share basis as it expanded.
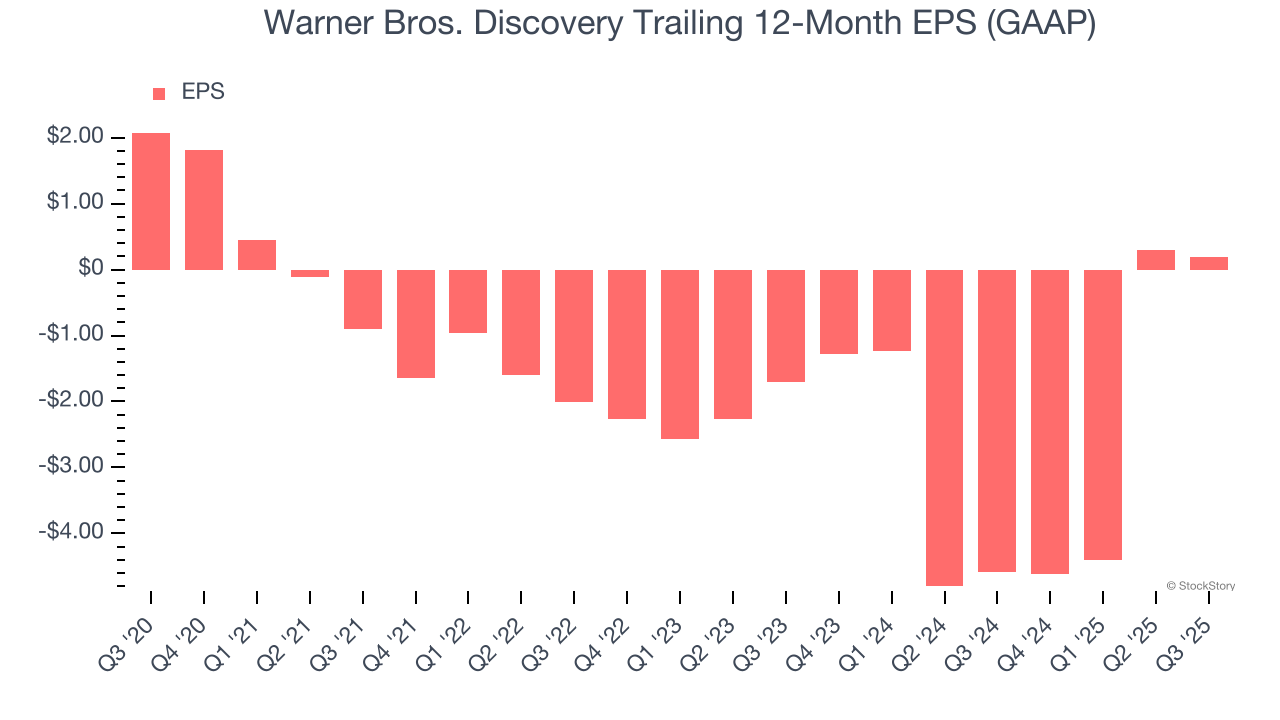
In Q3, Warner Bros. Discovery reported EPS of negative $0.06, down from $0.05 in the same quarter last year. Despite falling year on year, this print easily cleared analysts’ estimates. Over the next 12 months, Wall Street expects Warner Bros. Discovery to perform poorly. Analysts forecast its full-year EPS of $0.19 will invert to negative negative $0.34.
Key Takeaways from Warner Bros. Discovery’s Q3 Results
It was good to see Warner Bros. Discovery beat analysts’ EPS expectations this quarter. We were also glad its EBITDA outperformed Wall Street’s estimates. On the other hand, its Content revenue missed and its Advertising revenue fell short of Wall Street’s estimates. Overall, we think this was a mixed quarter. The stock remained flat at $22.54 immediately after reporting.
So do we think Warner Bros. Discovery is an attractive buy at the current price? If you’re making that decision, you should consider the bigger picture of valuation, business qualities, as well as the latest earnings. We cover that in our actionable full research report which you can read here, it’s free for active Edge members.