

Environmental and industrial services company Clean Harbors (NYSE:CLH) met Wall Street’s revenue expectations in Q1 CY2025, with sales up 4% year on year to $1.43 billion. Its GAAP profit of $1.09 per share was 1.3% above analysts’ consensus estimates.
Is now the time to buy Clean Harbors? Find out by accessing our full research report, it’s free.
Clean Harbors (CLH) Q1 CY2025 Highlights:
- Revenue: $1.43 billion vs analyst estimates of $1.44 billion (4% year-on-year growth, in line)
- EPS (GAAP): $1.09 vs analyst estimates of $1.08 (1.3% beat)
- Adjusted EBITDA: $231.2 million vs analyst estimates of $232.6 million (16.1% margin, 0.6% miss)
- EBITDA guidance for the full year is $1.18 billion at the midpoint, in line with analyst expectations
- Operating Margin: 7.8%, down from 9.1% in the same quarter last year
- Free Cash Flow was -$117.1 million compared to -$118.4 million in the same quarter last year
- Market Capitalization: $11.6 billion
“We began 2025 with a solid, first-quarter performance as our Environmental Services (ES) segment closed Q1 with a strong March helping to overcome unfavorable weather impacts early in the quarter and results in our Safety-Kleen Sustainability Solutions (SKSS) segment exceeded our expectations,” said Mike Battles, Co-Chief Executive Officer.
Company Overview
Established in 1980, Clean Harbors (NYSE:CLH) provides environmental and industrial services like hazardous and non-hazardous waste disposal and emergency spill cleanups.
Sales Growth
Examining a company’s long-term performance can provide clues about its quality. Any business can put up a good quarter or two, but many enduring ones grow for years. Thankfully, Clean Harbors’s 11.2% annualized revenue growth over the last five years was impressive. Its growth beat the average industrials company and shows its offerings resonate with customers.
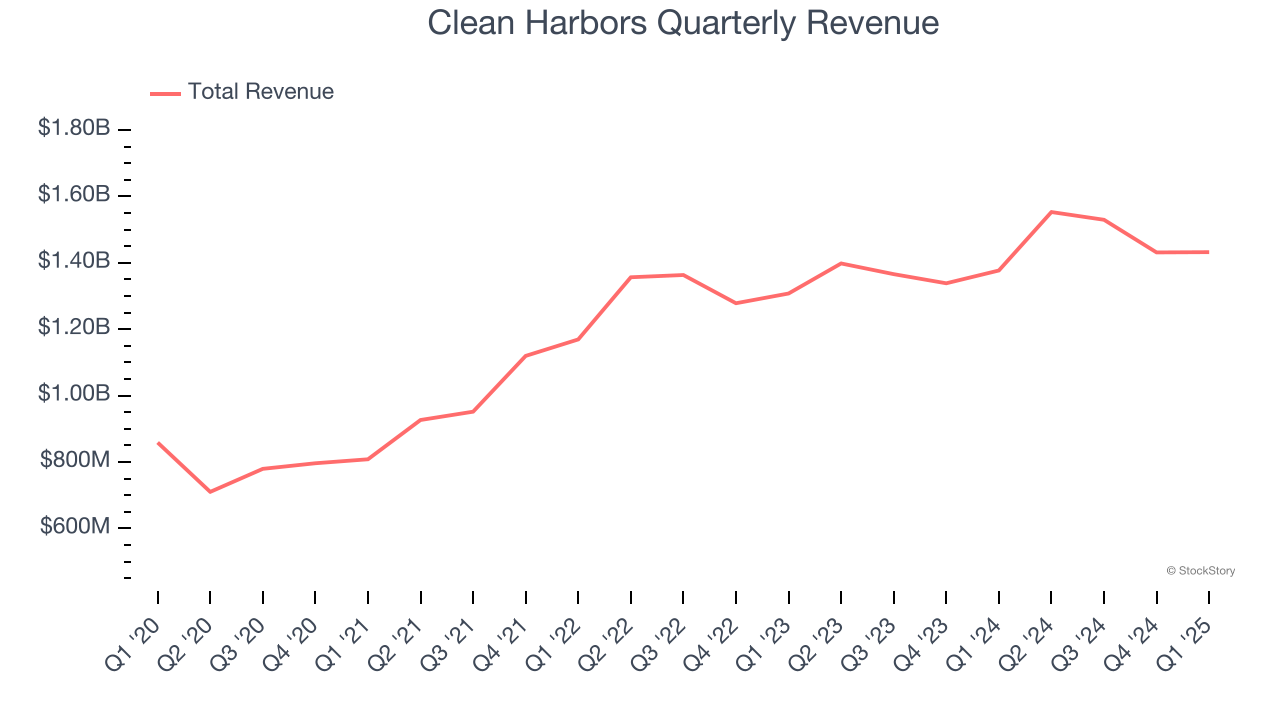
We at StockStory place the most emphasis on long-term growth, but within industrials, a half-decade historical view may miss cycles, industry trends, or a company capitalizing on catalysts such as a new contract win or a successful product line. Clean Harbors’s recent performance shows its demand has slowed significantly as its annualized revenue growth of 5.9% over the last two years was well below its five-year trend. 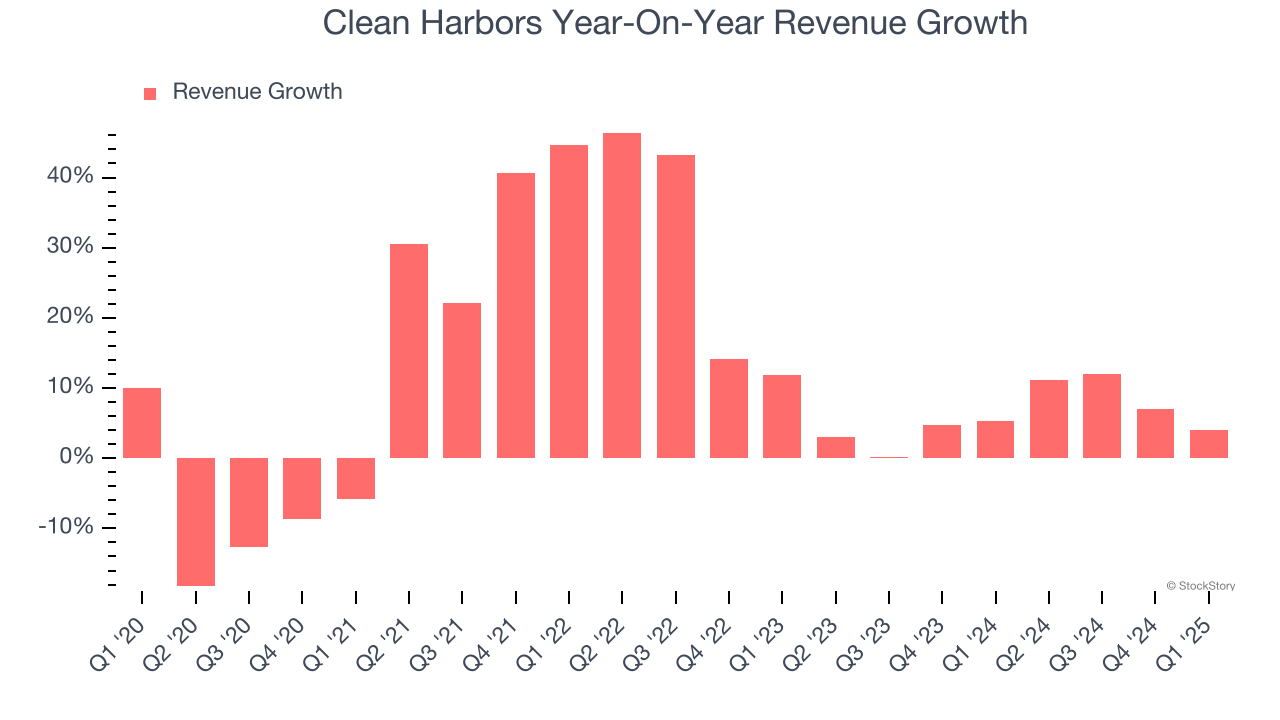
This quarter, Clean Harbors grew its revenue by 4% year on year, and its $1.43 billion of revenue was in line with Wall Street’s estimates.
Looking ahead, sell-side analysts expect revenue to grow 4.4% over the next 12 months, similar to its two-year rate. This projection is underwhelming and implies its products and services will face some demand challenges.
Here at StockStory, we certainly understand the potential of thematic investing. Diverse winners from Microsoft (MSFT) to Alphabet (GOOG), Coca-Cola (KO) to Monster Beverage (MNST) could all have been identified as promising growth stories with a megatrend driving the growth. So, in that spirit, we’ve identified a relatively under-the-radar profitable growth stock benefiting from the rise of AI, available to you FREE via this link.
Operating Margin
Clean Harbors has managed its cost base well over the last five years. It demonstrated solid profitability for an industrials business, producing an average operating margin of 10.8%.
Analyzing the trend in its profitability, Clean Harbors’s operating margin rose by 2.7 percentage points over the last five years, as its sales growth gave it operating leverage.
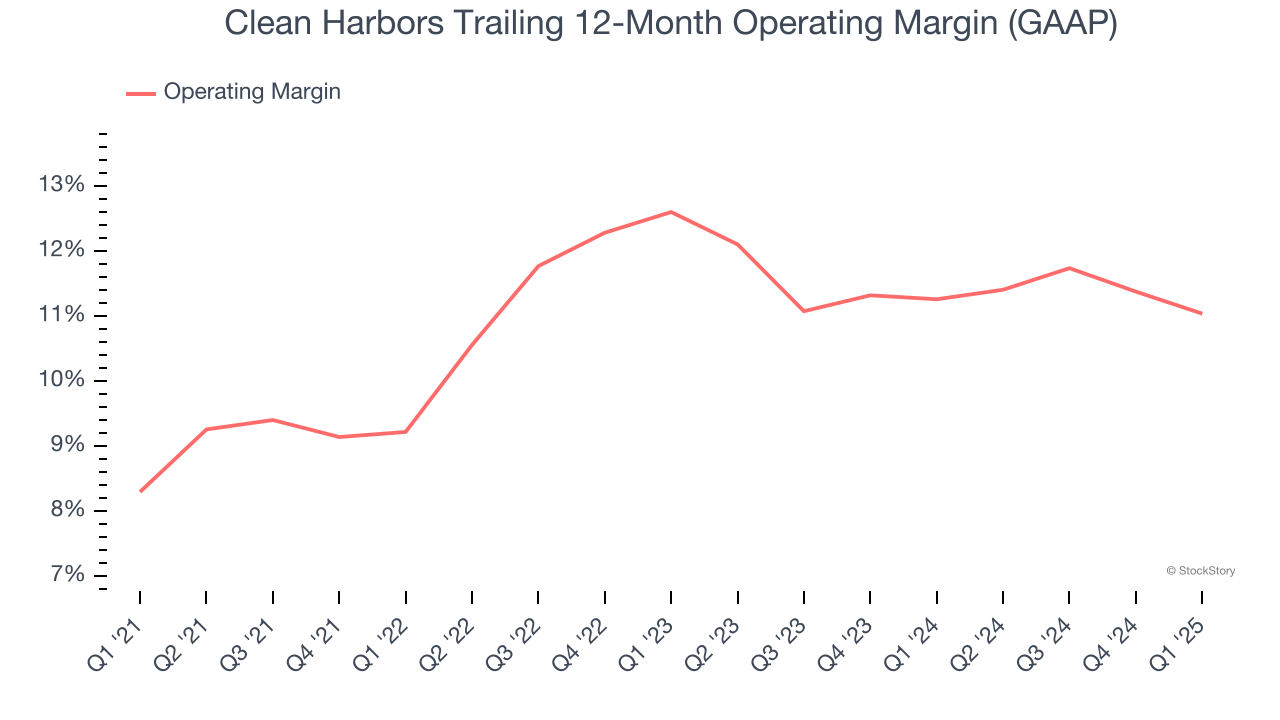
In Q1, Clean Harbors generated an operating profit margin of 7.8%, down 1.3 percentage points year on year. Since Clean Harbors’s operating margin decreased more than its gross margin, we can assume it was less efficient because expenses such as marketing, R&D, and administrative overhead increased.
Earnings Per Share
We track the long-term change in earnings per share (EPS) for the same reason as long-term revenue growth. Compared to revenue, however, EPS highlights whether a company’s growth is profitable.
Clean Harbors’s EPS grew at an astounding 30.2% compounded annual growth rate over the last five years, higher than its 11.2% annualized revenue growth. This tells us the company became more profitable on a per-share basis as it expanded.
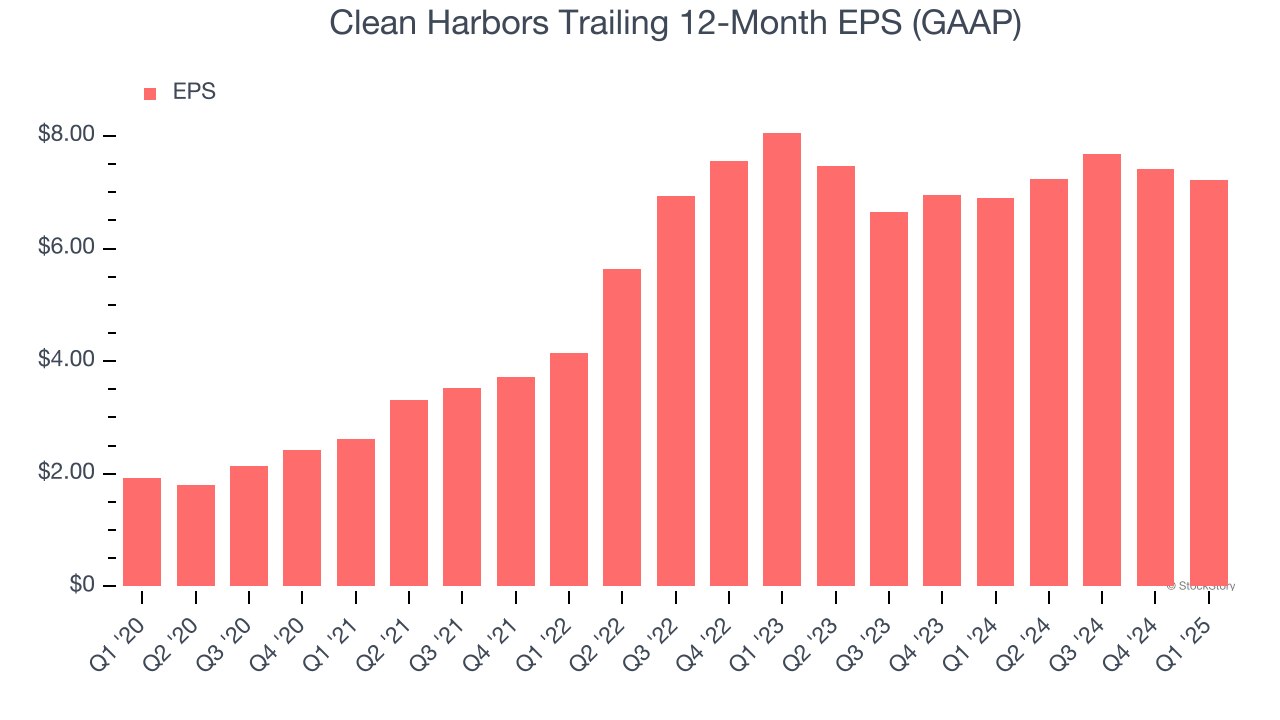
We can take a deeper look into Clean Harbors’s earnings to better understand the drivers of its performance. As we mentioned earlier, Clean Harbors’s operating margin declined this quarter but expanded by 2.7 percentage points over the last five years. Its share count also shrank by 3.7%, and these factors together are positive signs for shareholders because improving profitability and share buybacks turbocharge EPS growth relative to revenue growth. 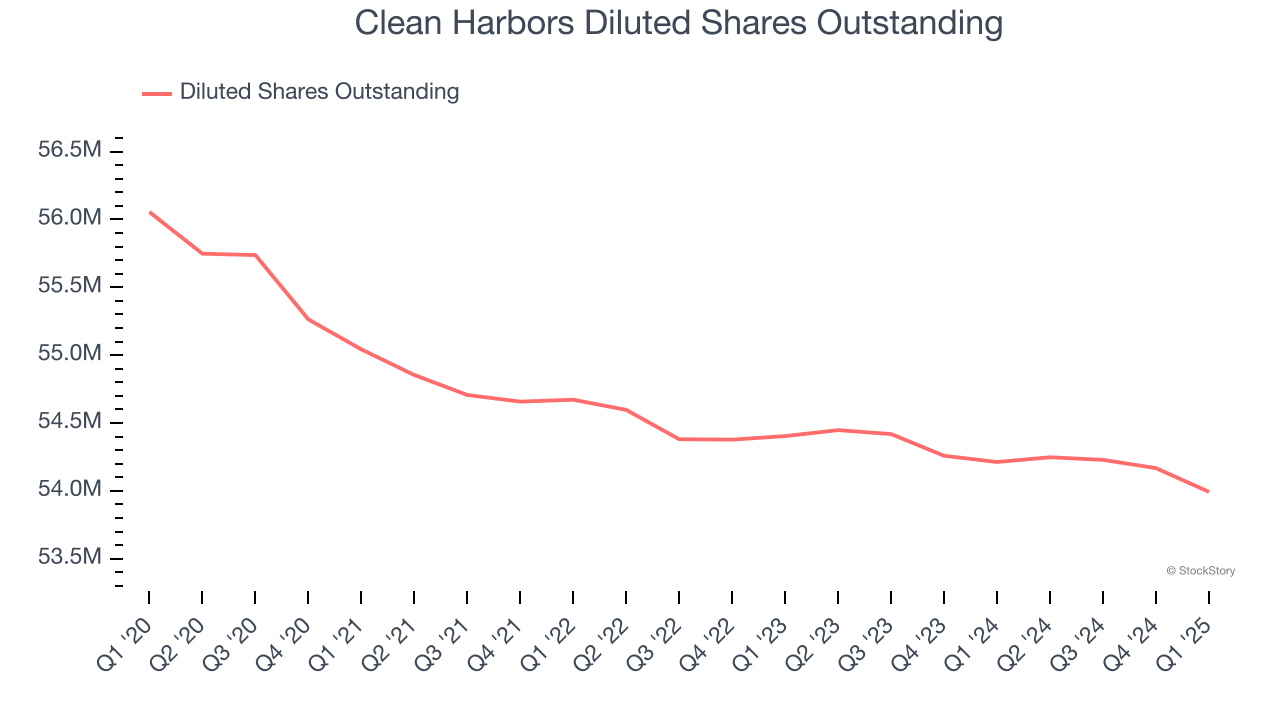
Like with revenue, we analyze EPS over a more recent period because it can provide insight into an emerging theme or development for the business.
For Clean Harbors, its two-year annual EPS declines of 5.3% mark a reversal from its (seemingly) healthy five-year trend. We hope Clean Harbors can return to earnings growth in the future.
In Q1, Clean Harbors reported EPS at $1.09, down from $1.29 in the same quarter last year. Despite falling year on year, this print beat analysts’ estimates by 1.3%. Over the next 12 months, Wall Street expects Clean Harbors’s full-year EPS of $7.22 to grow 10.6%.
Key Takeaways from Clean Harbors’s Q1 Results
It was good to see Clean Harbors provide full-year EBITDA guidance that met analysts’ expectations. On the other hand, this quarter's EBITDA fell slightly short of Wall Street’s estimates. Zooming out, we think this was a decent print featuring some areas of strength but also some blemishes. The stock remained flat at $211.99 immediately following the results.
Is Clean Harbors an attractive investment opportunity right now? What happened in the latest quarter matters, but not as much as longer-term business quality and valuation, when deciding whether to invest in this stock. We cover that in our actionable full research report which you can read here, it’s free.