

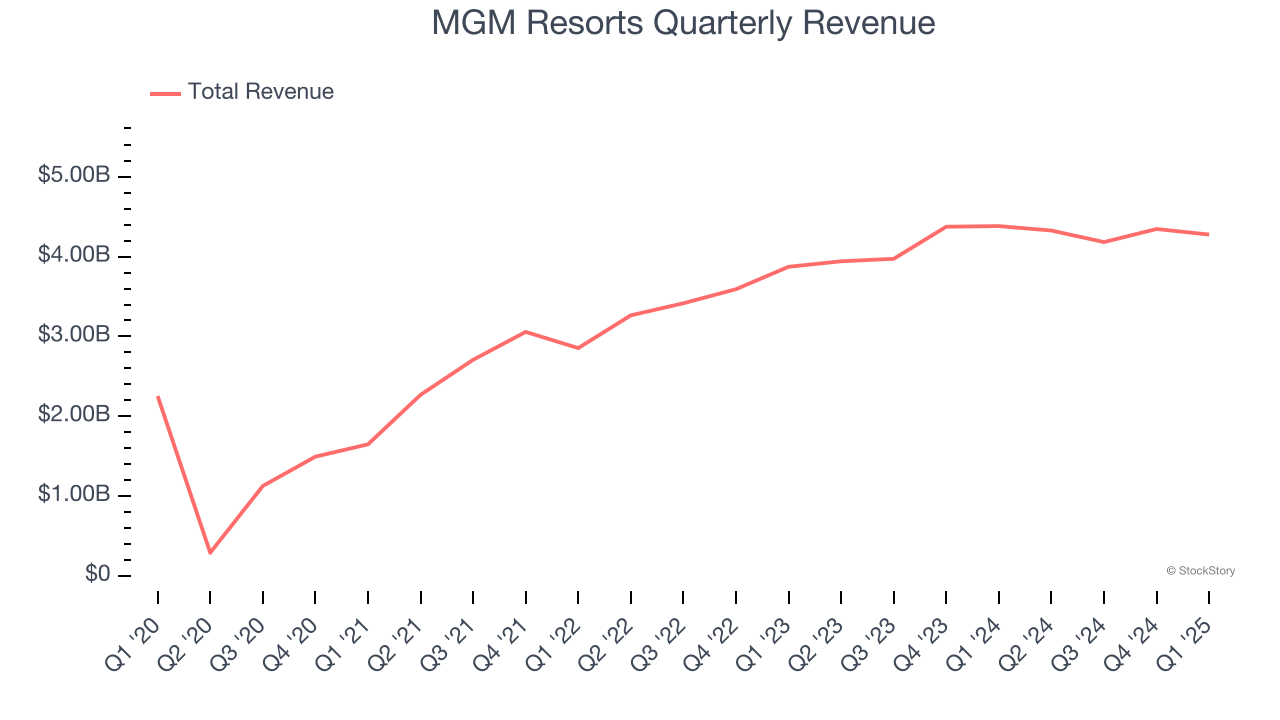
Hospitality and casino entertainment company MGM Resorts (NYSE:MGM) met Wall Street’s revenue expectations in Q1 CY2025, but sales fell by 2.4% year on year to $4.28 billion. Its non-GAAP profit of $0.69 per share was 51.5% above analysts’ consensus estimates.
Is now the time to buy MGM Resorts? Find out by accessing our full research report, it’s free.
MGM Resorts (MGM) Q1 CY2025 Highlights:
- Revenue: $4.28 billion vs analyst estimates of $4.27 billion (2.4% year-on-year decline, in line)
- Adjusted EPS: $0.69 vs analyst estimates of $0.46 (51.5% beat)
- Adjusted EBITDA: $637.1 million vs analyst estimates of $1.14 billion (14.9% margin, 44.2% miss)
- Operating Margin: 9%, down from 10.5% in the same quarter last year
- Market Capitalization: $9.00 billion
"MGM Resorts achieved strong first quarter results across our portfolio in the face of the well anticipated comparison to last year's Super Bowl in Las Vegas, highlighted by a positive EBITDA performance at our BetMGM venture," said Bill Hornbuckle, Chief Executive Officer & President of MGM Resorts International.
Company Overview
Operating several properties on the Las Vegas Strip, MGM Resorts (NYSE:MGM) is a global hospitality and entertainment company known for its resorts and casinos.
Sales Growth
Examining a company’s long-term performance can provide clues about its quality. Even a bad business can shine for one or two quarters, but a top-tier one grows for years. Regrettably, MGM Resorts’s sales grew at a sluggish 7.4% compounded annual growth rate over the last five years. This fell short of our benchmark for the consumer discretionary sector and is a tough starting point for our analysis.
Long-term growth is the most important, but within consumer discretionary, product cycles are short and revenue can be hit-driven due to rapidly changing trends and consumer preferences. MGM Resorts’s annualized revenue growth of 10.1% over the last two years is above its five-year trend, but we were still disappointed by the results. Note that COVID hurt MGM Resorts’s business in 2020 and part of 2021, and it bounced back in a big way thereafter. 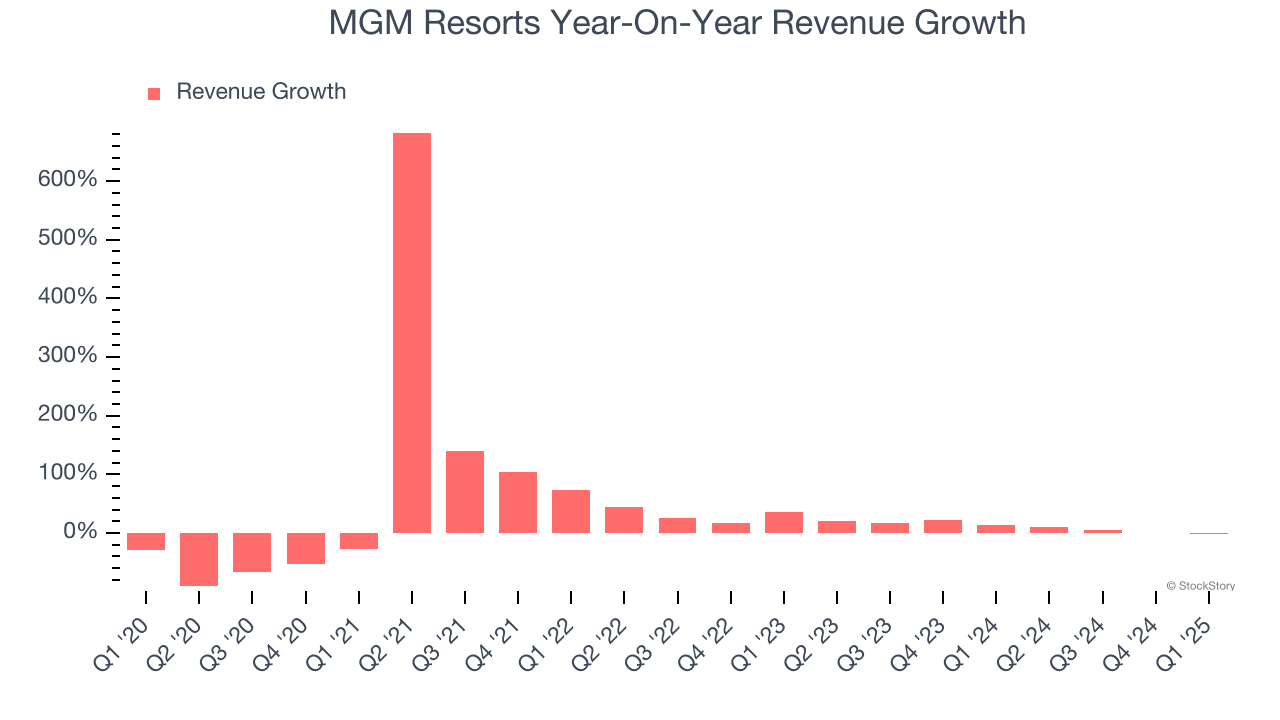
MGM Resorts also breaks out the revenue for its three most important segments: Casino, Hotel, and Dining, which are 52.7%, 20.2%, and 18% of revenue. Over the last two years, MGM Resorts’s revenues in all three segments increased. Its Casino revenue (Poker, sports betting) averaged year-on-year growth of 21.1% while its Hotel (overnight bookings) and Dining (food and beverage) revenues averaged 3.9% and 4.3%.
This quarter, MGM Resorts reported a rather uninspiring 2.4% year-on-year revenue decline to $4.28 billion of revenue, in line with Wall Street’s estimates.
Looking ahead, sell-side analysts expect revenue to remain flat over the next 12 months, a deceleration versus the last two years. This projection is underwhelming and indicates its products and services will see some demand headwinds.
Here at StockStory, we certainly understand the potential of thematic investing. Diverse winners from Microsoft (MSFT) to Alphabet (GOOG), Coca-Cola (KO) to Monster Beverage (MNST) could all have been identified as promising growth stories with a megatrend driving the growth. So, in that spirit, we’ve identified a relatively under-the-radar profitable growth stock benefiting from the rise of AI, available to you FREE via this link.
Operating Margin
Operating margin is a key measure of profitability. Think of it as net income - the bottom line - excluding the impact of taxes and interest on debt, which are less connected to business fundamentals.
MGM Resorts’s operating margin has shrunk over the last 12 months and averaged 9% over the last two years. The company’s profitability was mediocre for a consumer discretionary business and shows it couldn’t pass its higher operating expenses onto its customers.
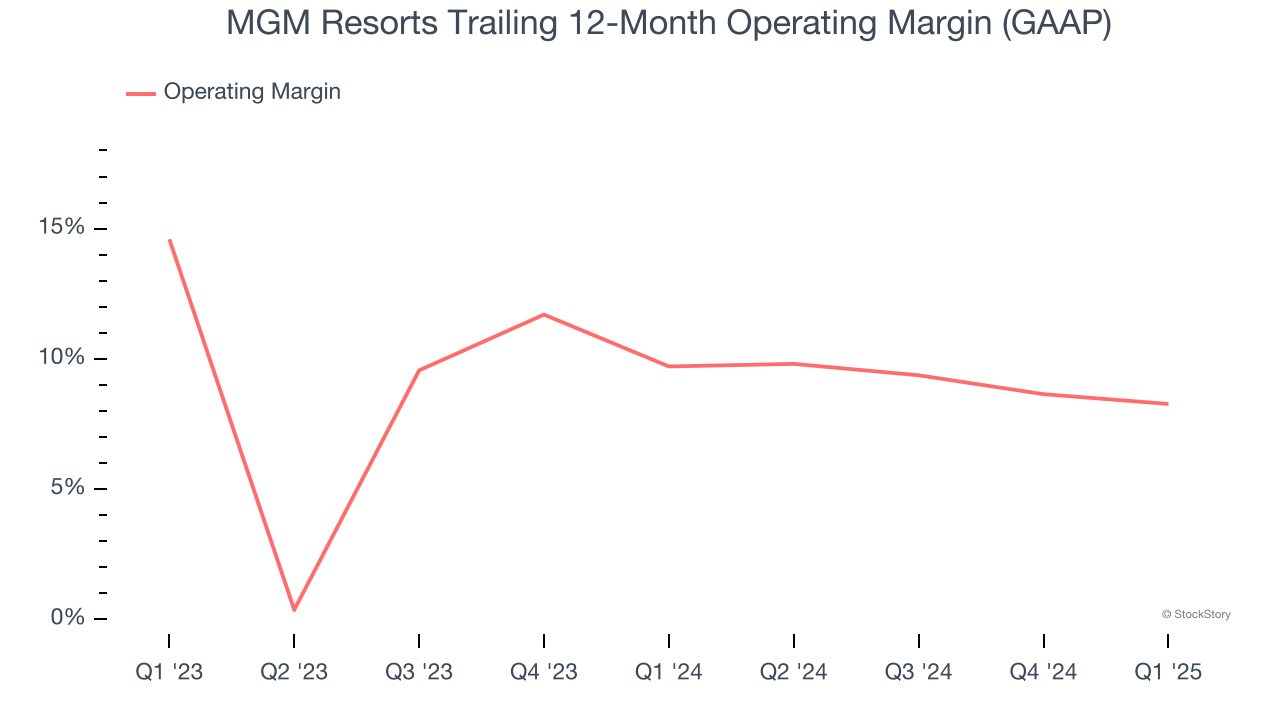
This quarter, MGM Resorts generated an operating profit margin of 9%, down 1.5 percentage points year on year. This reduction is quite minuscule and indicates the company’s overall cost structure has been relatively stable.
Earnings Per Share
We track the long-term change in earnings per share (EPS) for the same reason as long-term revenue growth. Compared to revenue, however, EPS highlights whether a company’s growth is profitable.
MGM Resorts’s EPS grew at an astounding 70.1% compounded annual growth rate over the last five years, higher than its 7.4% annualized revenue growth. However, this alone doesn’t tell us much about its business quality because its operating margin didn’t expand.
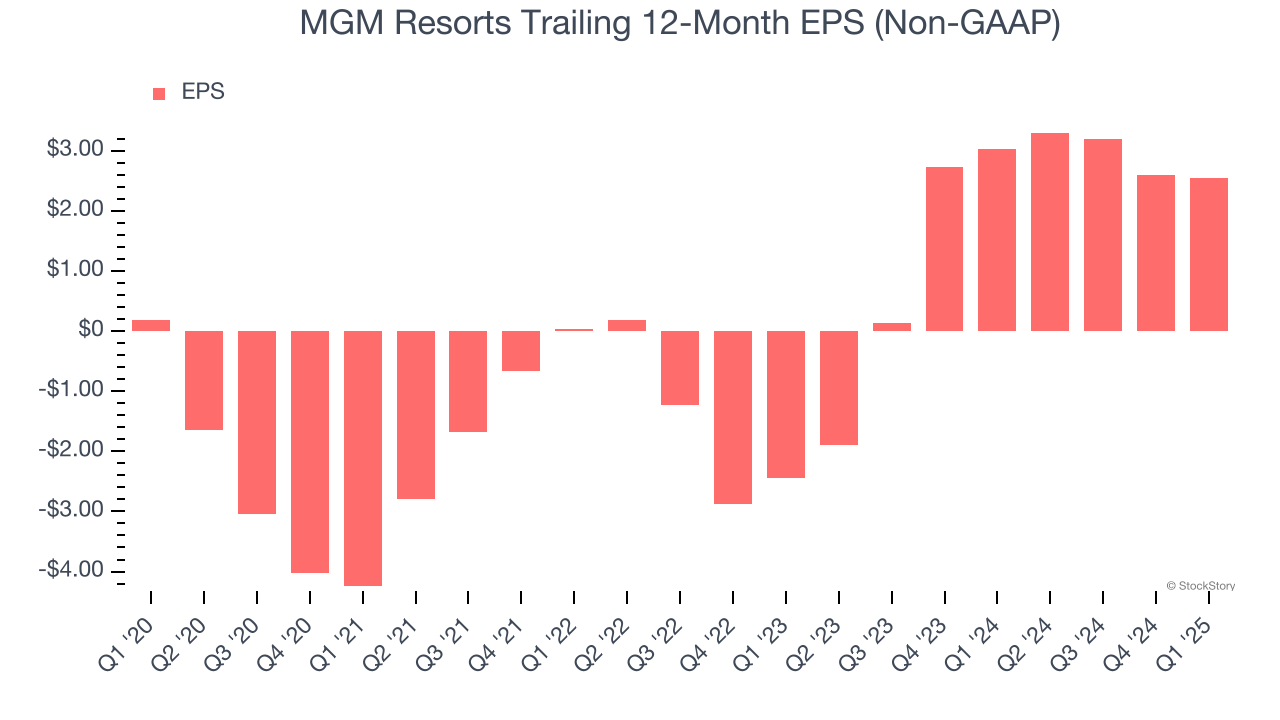
In Q1, MGM Resorts reported EPS at $0.69, down from $0.74 in the same quarter last year. Despite falling year on year, this print easily cleared analysts’ estimates. Over the next 12 months, Wall Street expects MGM Resorts’s full-year EPS of $2.54 to shrink by 11.9%.
Key Takeaways from MGM Resorts’s Q1 Results
We were impressed by how significantly MGM Resorts blew past analysts’ EPS expectations this quarter. On the other hand, its EBITDA missed significantly and its Casino revenue fell short of Wall Street’s estimates. Zooming out, we think this was a decent quarter featuring some areas of strength but also some blemishes. The stock traded up 3.4% to $32.50 immediately after reporting.
So do we think MGM Resorts is an attractive buy at the current price? The latest quarter does matter, but not nearly as much as longer-term fundamentals and valuation, when deciding if the stock is a buy. We cover that in our actionable full research report which you can read here, it’s free.